Data Visualization Color Palette Tool
Building an intelligent color palette tool for data visualization
AI Tooling • Accessibility
Problem
- Current default palette does not meet WCAG 2.1 Success Criterion 1.4.11 Non-text Contrast (AA).
- Default palette uses older Canvas 13 colors
- There's an urgent, high demand to integrate data visualizations within the Ask Workday UI. AI/ML teams are currently using charting logic built into LLMs, but they require formal guidance on usage and a consistent look and feel for the visualizations.
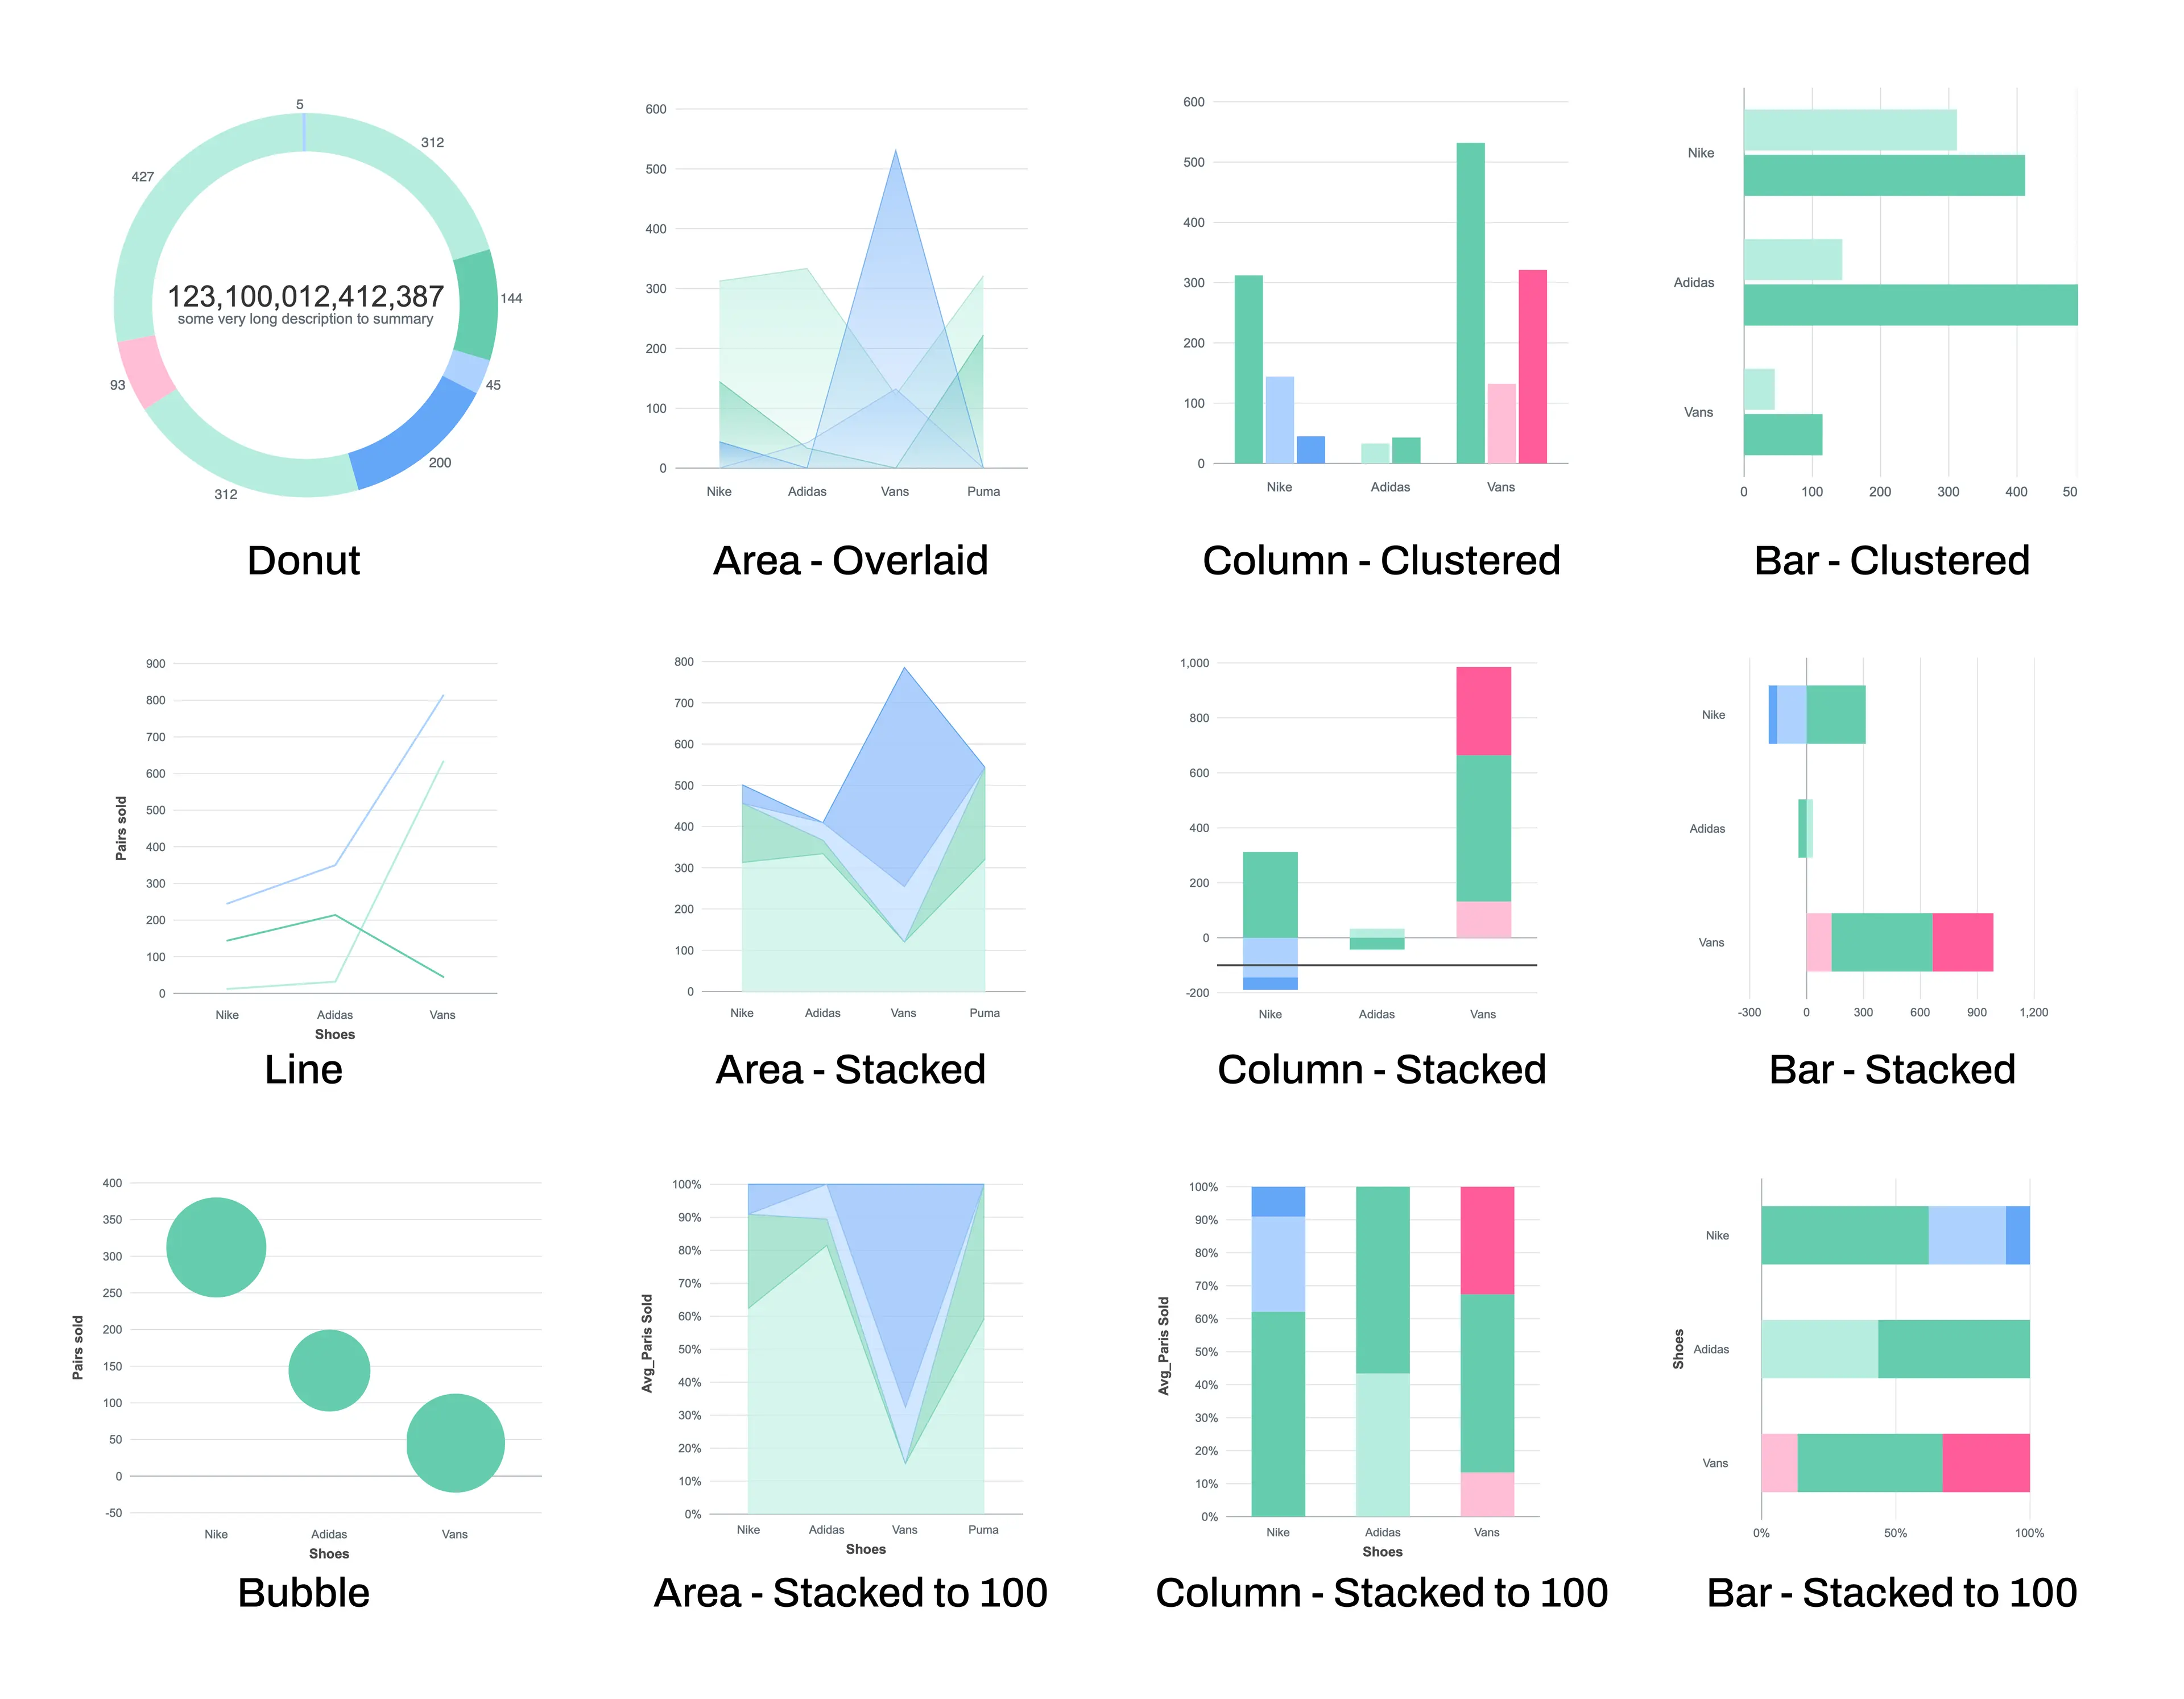
Workday Charts
Goals
- Design and establish a palette of 12 (or 16) colors that all meet the WCAG 2.1 Success Criterion 1.4.11 Non-text Contrast (AA), ensuring all graphical objects have a contrast ratio of at least 3:1 against any adjacent colors.
- Colors will be aligned to new Canvas 14 library.
- Design & establish a style guide to the core 10 chart types (donut, line chart, column*, bars*, area*, scatter plot, bubble, waterfall, heatmap** & funnel)
3. Building with AI Tools
Why Lovable/Vibe?
[Explain why you chose Lovable/Vibe or other AI coding tools. What attracted you to these tools? What advantages do they offer?]
Development Process with AI Coding Assistant
[Describe your development process. How did you work with the AI assistant? What was your workflow?]
Add images: assets/development-process.jpg
How AI Helped (and Where You Guided It)
[Explain how AI helped accelerate development. What did it do well? Where did you need to guide it? What was the collaboration like?]
Iteration Cycle
[Describe the iteration cycle. How quickly could you iterate? What was the feedback loop like?]
4. The Tool
Key Features
[List and describe the key features of the tool.]
- [Feature 1]
- [Feature 2]
- [Feature 3]
Live Demo/Screenshots
How It Works (User Flow)
[Describe the user flow. How do users interact with the tool? What's the step-by-step process?]
Add video or GIF: assets/tool-demo.gif
Design Decisions
[Explain key design decisions. Why did you design it this way? What principles guided you?]
Add images: assets/palette-examples.jpg
5. Technical Implementation
Tech Stack Overview
[Brief overview of the tech stack. Don't go too deep, but give a sense of what technologies were used.]
- [Technology 1]
- [Technology 2]
- [Technology 3]
Interesting Technical Challenges
[Describe interesting technical challenges you faced and how you solved them.]
Add image: assets/code-snippet.jpg
How You Ensured Accessibility
[Explain how you ensured accessibility in the technical implementation. What checks did you build in?]
6. Outcomes & Learnings
Link to Live Tool
[Provide link to the live tool or describe where it's hosted.]
View Live Tool →User Feedback
[Include any user feedback you've received. What are people saying about it?]
"[Add user feedback quote if available]"
— User/Designer
What I Learned About Data Viz Color Theory
[Share learnings about data visualization color theory. What insights did you gain?]
What I Learned About Building with AI Tools
[Reflect on building with AI tools. What worked well? What didn't? What would you do differently?]
What I Learned About Shipping Quickly
[Reflect on the experience of shipping quickly. What did you learn about rapid development?]
Add images: assets/before-viz.jpg, assets/after-viz.jpg
Future Improvements
[What would you improve? What features would you add? Show continuous improvement mindset.]
- [Improvement 1]
- [Improvement 2]
- [Improvement 3]
7. Why This Matters
Shows Initiative (Building in Public)
[Explain how this project demonstrates initiative and building in public. What does it say about you as a designer?]
Demonstrates Domain Expertise (Data Viz)
[How does this project demonstrate your expertise in data visualization?]
Modern Tooling (AI Coding Tools)
[How does using AI coding tools demonstrate your adaptability and willingness to embrace new technologies?]
Accessibility Focus
[How does the accessibility focus demonstrate your values and commitment to inclusive design?]
Project Credits
Design & Development
Shanthi Acharya
Tools Used
[List AI tools and other technologies used]
This personal project demonstrates initiative, domain expertise, and the ability to leverage modern tools to create valuable solutions quickly.