Scaling Prism Analytics
Designing the Data Backbone That Powers Workday's Enterprise Growth
Product Design Leadership
Background
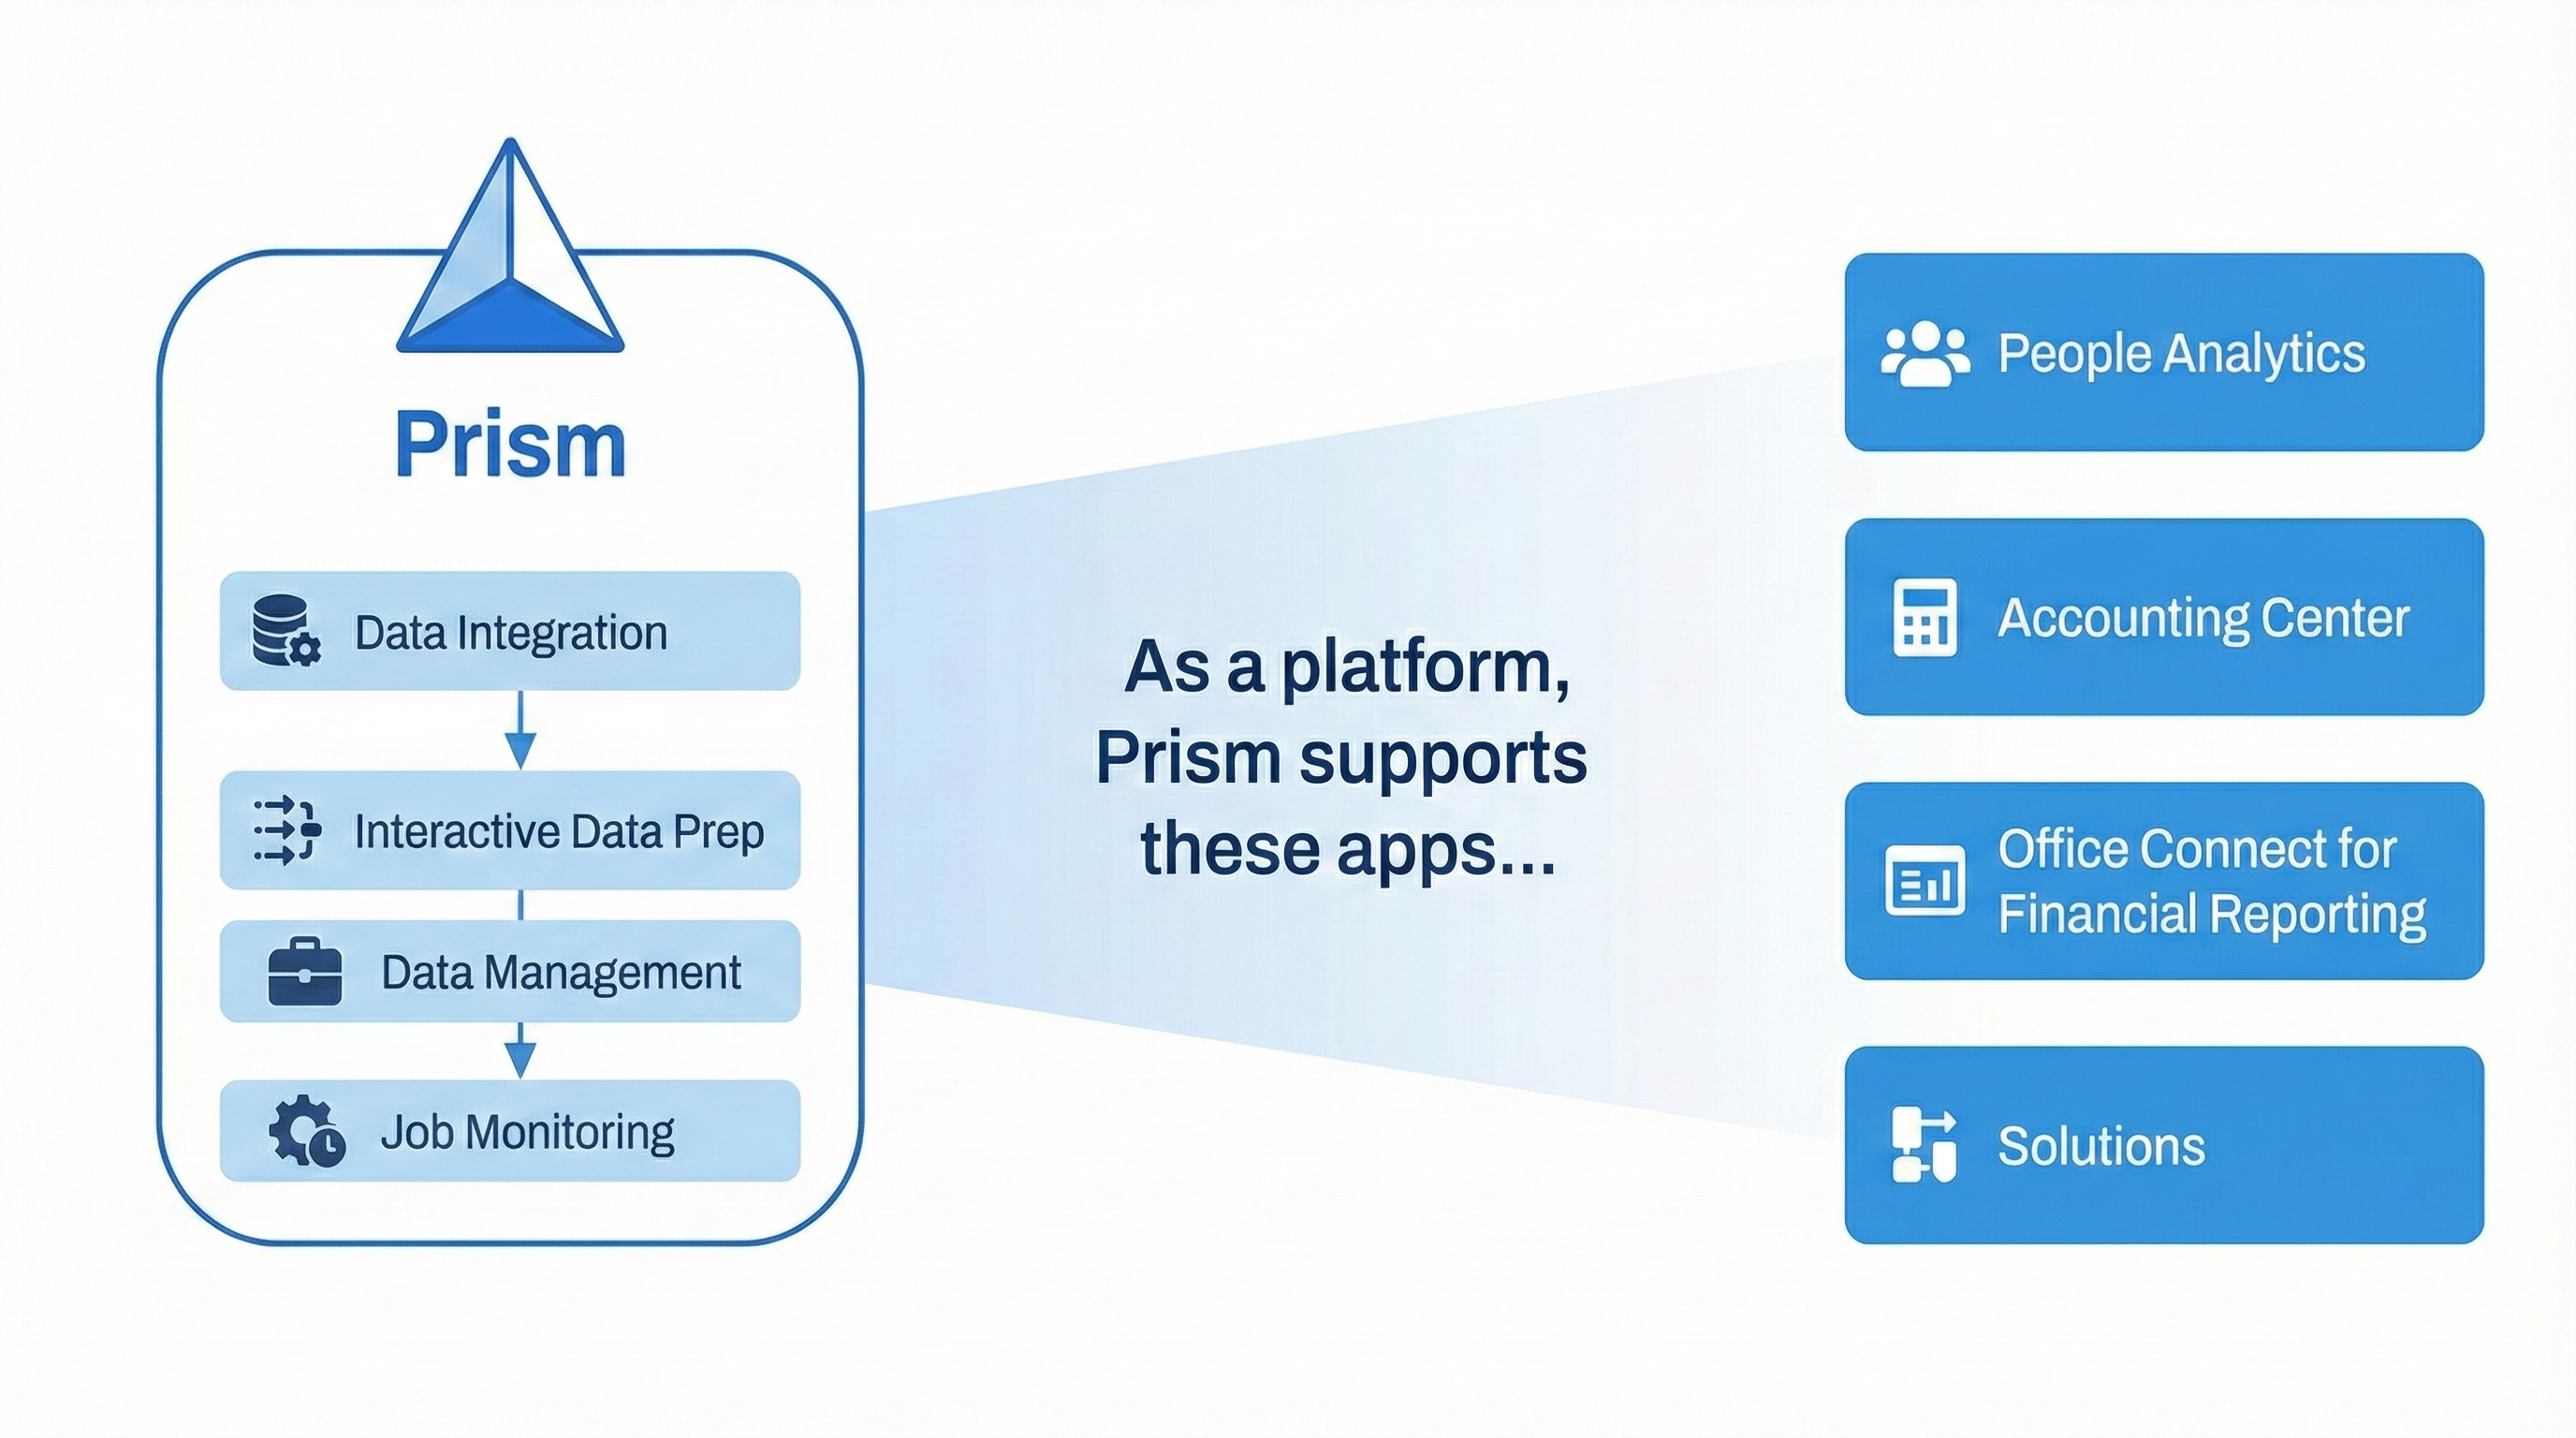
Workday Prism Analytics is a powerful, flexible data hub that ingests and transforms large datasets, including operational and historical data, to give customers a single source of truth across finance and HR. The purpose of Workday Prism Analytics is to allows customers bring together external workforce data with Workday data, empowering teams with secure self-service access to the insights they need.
The Challenge
When Workday first acquired the platform that became Prism Analytics, it lacked the scalability and robustness required for enterprise-grade operations. Over five years, I led the design evolution of the product across four critical pillars. By moving from file-based systems to high-performance table architectures and shifting from linear workflows to canvas-based UX, we transformed Prism into the essential data backbone for the Workday Accounting Center and HR Insights, significantly driving the "Fin Attach" rate for the sales organization.
My Role
Player-Coach Design Lead
- Led design strategy across 4 product pillars while shipping hands-on work with 5 Scrum teams
- Mentored and supported the growth of 10 designers, resulting in 2 promotions to senior level.
- Balanced strategic visioning with tactical execution & prototyping
- Collaborated with product managers, engineers, researchers, and technical writers
Leadership & Process
Established a design culture that focused on:
- Multi-Release Visioning
- Designing for the "North Star" while delivering incremental value across multi-year roadmaps.
- Cross-Functional Synergy
- Partnering with engineering to ensure "Table-based" performance met the UX requirements for speed.
- Systems Thinking
- Ensuring that a change in the "Integration" pillar was reflected intuitively in the "Monitoring" and "Management" pillars.
Customer Empathy
Understanding the complex world of enterprise data analysts and administrators required deep immersion into their daily challenges, goals, and frustrations. I led the effort to transform raw research insights into actionable frameworks that the entire team could rally around.
Jobs To Be Done Framework
By applying the Jobs To Be Done methodology, we moved beyond surface-level feature requests to understand the underlying motivations driving user behavior. We identified critical jobs like "Help me trust that my data pipelines are running correctly" and "Give me confidence that I can trace any data issue back to its source."
Living Journey Maps
Rather than creating static artifacts that would gather dust, I developed dynamic journey maps that became living documents—continuously updated as we learned more about our users. These maps captured the emotional highs and lows of data analysts as they moved from data ingestion through transformation to final reporting, highlighting key moments where design intervention could reduce friction and anxiety.
Image placeholder: JTBD framework and journey mapping artifacts
"These journey maps became our north star—every design decision was validated against the emotional and functional needs we had mapped out together as a team."
Competitive Positioning
To ensure Prism Analytics would stand out in the enterprise data platform landscape, I conducted a comprehensive competitive analysis that went beyond feature comparison to understand strategic positioning opportunities.
Competitive Landscape Study
Analyzed direct competitors in the enterprise analytics space as well as adjacent solutions that customers were using. This revealed gaps in the market around seamless Workday integration, self-service data preparation, and unified monitoring experiences.
Kano Model Prioritization
Used the Kano model to categorize potential features into must-haves, performance attributes, and delighters. This framework helped the team make tough prioritization decisions by distinguishing between features that would merely satisfy expectations versus those that could truly differentiate the product and drive customer delight.
Image placeholder: Competitive analysis matrix and Kano model visualization
UX Patterns & Documentation
As the Prism design system grew across four pillars, I recognized the need for consistent patterns that could scale across multiple product areas. I established a documentation practice that would accelerate development and ensure design consistency.
Pattern Library
Created a comprehensive library of reusable UI patterns specific to data platform contexts—including data preview tables, pipeline visualizations, error state displays, and schema management interfaces. Each pattern was documented with usage guidelines, accessibility considerations, and code specifications.
Design-Dev Handoff Standards
Established clear handoff documentation standards that reduced back-and-forth between design and engineering. This included interaction specifications, responsive behavior rules, and edge case handling that developers could reference throughout implementation.
Image placeholder: UX pattern library and documentation samples
Strategic Pillars
Four foundational areas drove the transformation, each addressing critical user needs and business objectives.
Business Outcomes
The transformation of Prism Analytics delivered measurable impact across the organization.